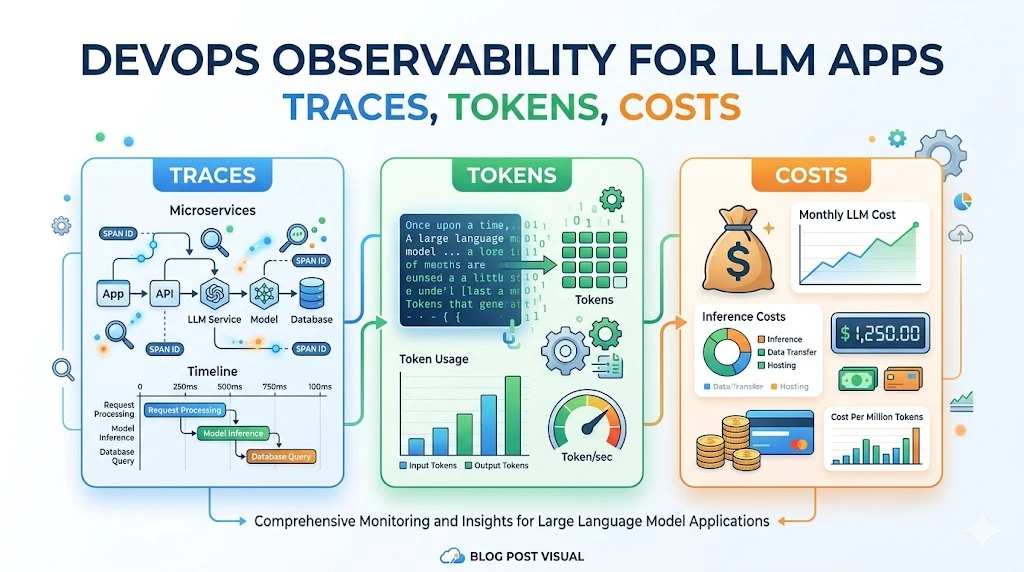
LLM apps fail in ways traditional observability does not catch. A 200 OK with a hallucinated response is a failure. A 99th-percentile token count is a budget alarm. Here are the three dashboards we set up on every project before week two.
Dashboard 1: latency and quality
End-to-end p50, p90, p99. Per-stage breakdown (retrieval, generation, post-processing). Quality score per response from a judge model, sampled and rolled up daily. The latency view tells you when things are slow; the quality view tells you when they are wrong.
Dashboard 2: cost
Tokens in and out per request, rolled up by endpoint and by user. Daily projected spend vs. budget. Top 10 most expensive requests in the last hour. That last one is critical, since it surfaces the runaway prompt or the unbounded recursion before billing does.
Dashboard 3: tool calls
Tool call success rate, latency, and retry rate. Frequency of each tool in the agent's mix. Tool-call sequences that ended in failure, with the full trace.
Wiring it up
Every LLM call gets a span. Every span has token counts, model, latency, and a quality tag. Everything rolls up from there.
OpenTelemetry for traces, with custom span attributes for tokens and cost. LangChain's callback system can write the spans, but we've largely replaced the built-in callbacks with our own, which are less surprising and easier to test.
What we wish we did sooner
- Log the prompt and the response, not just the tokens. Disk is cheap; debugging without the actual text is hell.
- Add a trace ID to every user-facing response (in a header or a debug field). When a user complains, you can find the run in seconds.
- Build the cost dashboard before the launch, not after the first invoice.